When do most submissions happen in a BJJ match?
I’ll admit, I’m really, really, really new to this statistics thing, and I couldn’t explain the math behind a lot of the analysis. I’m just Googling how to do these things and trying to understand what’s coming out the other side. I think I’m getting it mostly correct, but if there are any stat people out there who want to weigh in, please do.
As I’ve been combing through all of this data from the 2025 NAGA and Grappling Industries competitions on Smoothcomp, I’ve been trying to see if there is any actionable information hidden away. While I’m finding the information interesting, just knowing submission averages and statistical influences doesn’t tell the whole story of what’s happening on the mats. It also doesn’t necessarily translate to something competitors and coaches could use.
But! What if we knew at which time in a match submissions tend to happen? That might be useful.
So I plugged the numbers into the spreadsheet again, shook them around, and plotted out the distribution of submissions over match length.
Yeah, I’m a huge nerd. Shut up.
It’s really easy to fall down the rabbit hole here and run this analysis for all of the different divisions, like age and weight class, and then even further by gender, and before you know it, there are dozens of charts to look at. I’m going to do it eventually, because hey, why not, but for now, I looked at two things:
What percentage of matches ended by submission at different points in the match?
What is the probability that a match will end at different points of the match?
% of submissions by time
For ease of use and analysis, I divided the match times into 30 second “buckets” (0:00-0:30, 0:30-1:00, etc.) and looked at the percentage of all submissions for that ability level that occurred sometime during that bucket. Because the fun debate within the BJJ community is gi vs no-gi, I looked at each of them separately. This came out to be 11,934 gi matches, and 20,060 no-gi matches used in this analysis.
(Forgive the difference in chart sizes.)
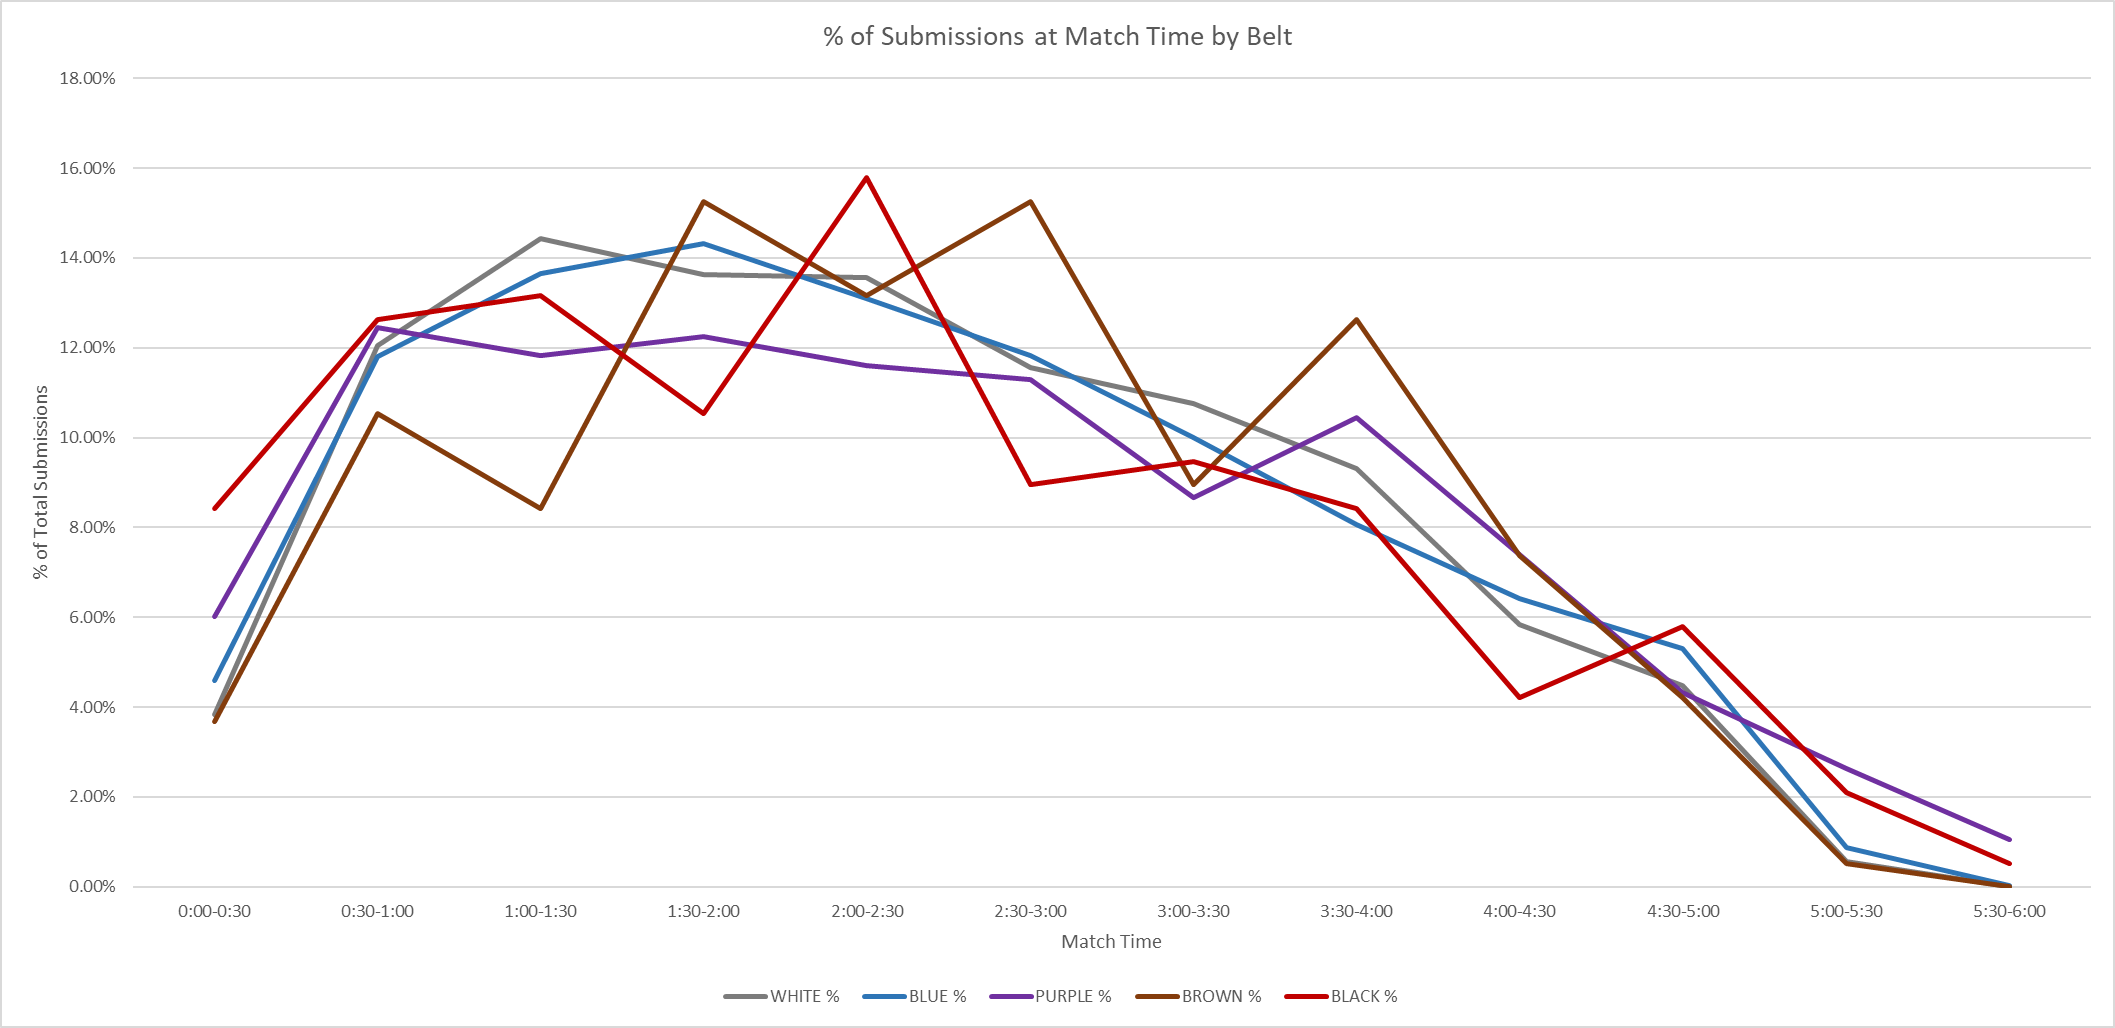
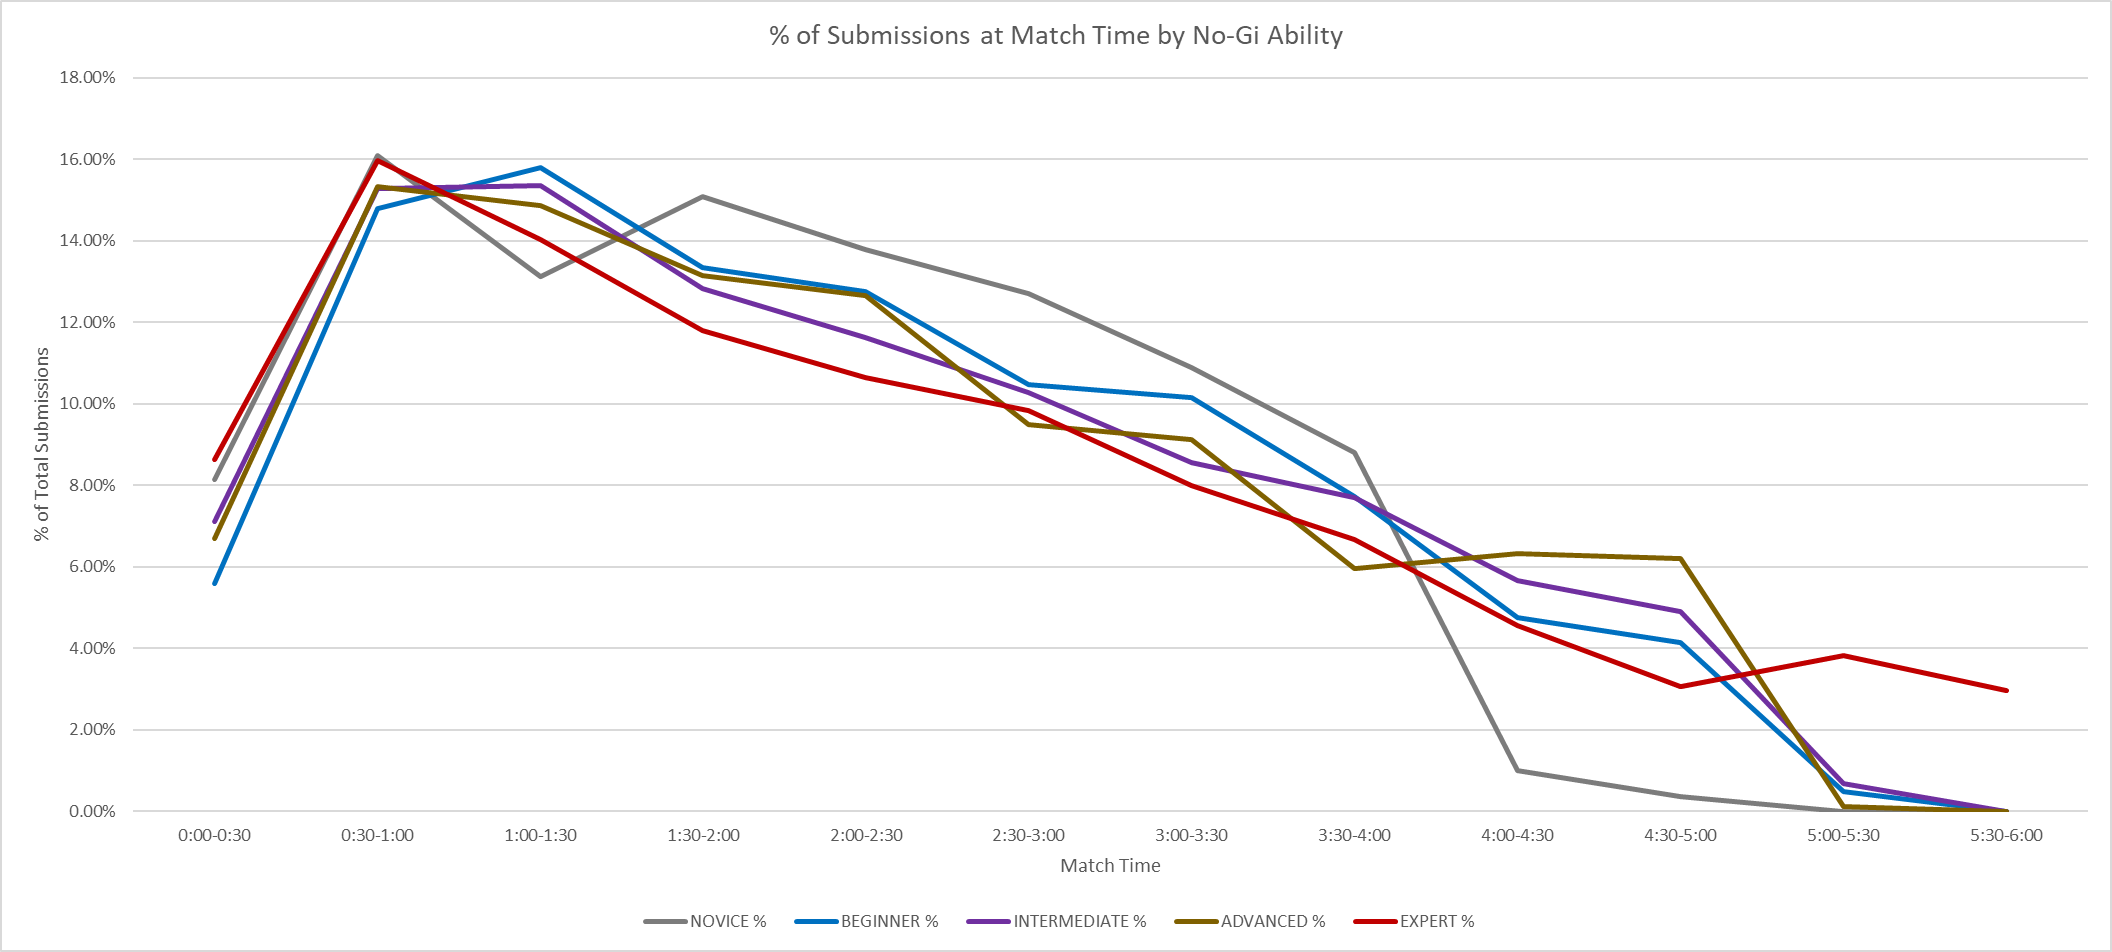
Without getting into whether something is statistically relevant here, let’s just look at what we can see: gi matches have a higher concentration of submissions overall that occur in the middle of a match, where no-gi matches have a much higher concentration overall at the beginning of the match, and it slowly tapers off over time.
What also grabs my attention here is the apparent volatility in gi matches between different belts. Brown and black belts seem to have more spikes than white, blue, and purple belts, who all seem to have a pretty smooth journey throughout the match (grows quickly at the beginning, peaks at about 2:00 in, and then tapers off).
How this might apply to competition prep
The numbers don’t tell us about what causes these spikes, or even the overall progression, and it would require more in-depth research involving match observations to connect the two. That being said, we might be able to infer a few things based on real-world experience that could act as possible explanations.
In the no-gi chart, we see that big spike across all abilities, and with the exception of the intermediate division, they all fall off, never reaching that peak again. Intermediate peaks in the 1:00-1:30 bucket, and then follows the same trend as the others. This could mean that no-gi matches tend to start with a lot more energy, a flurry of activity in the first minute to minute-and-a-half, and then it settles down into a more subdued pace.
If this turns out to be the case, I would focus my athletes on improving cardio; if they have more gas in the tank, they can survive that first minute and then keep up a higher level of intensity, possibly giving them an advantage in the second minute. I would also coach them to watch out for that initial flurry of activity, focus on defending and looking for mistakes to capitalize on, and to not attempt to match your opponent’s intensity. Play your game, not theirs.
On the gi side of things, there appears to be a much longer “growth” period, with most of the matches reaching their peak submission concentration in the middle of the match, and lots of volatility in the more advanced belt divisions. In this case, we could infer that gi matches tend to start at a slower pace, and that there is a more strategic game being played that takes some time to develop.
One coaching strategy might be to have your athletes attempt to overwhelm their opponent in the first minute or two to create discomfort. This can work only if that athlete has great cardio, as their opponent may just wait them out, and if they are very technical as they increase the intensity. Again, if their opponent is just being patient, if your athlete makes mistakes and/or leaves openings during that higher intensity, they’ll find themselves in a bad position come the middle of the round.
Another piece to pay attention to here as a coach or athlete is that volatility that we see in purple, brown, and black belts. That would tell me that as the match progresses, the athlete can’t let their attention wander or allow fatigue to result in mistakes. Those advanced belts seem to be playing the long game, and are more patient, waiting for or creating opportunities as the match progresses.
Match hazard analysis
Next up, I did some calculations to figure out what the probability is that a match will end in one of those buckets; put another way, the longer the match goes, what the likelihood is that it will end at any given time.
For this, I had to divide up the dataset a little differently, as NAGA has different match lengths for different belts/abilities, and Grappling Industries has a standard 5-minute match length for all adult matches. In order to compare apples to apples, I took a look at NAGA matches for this one.
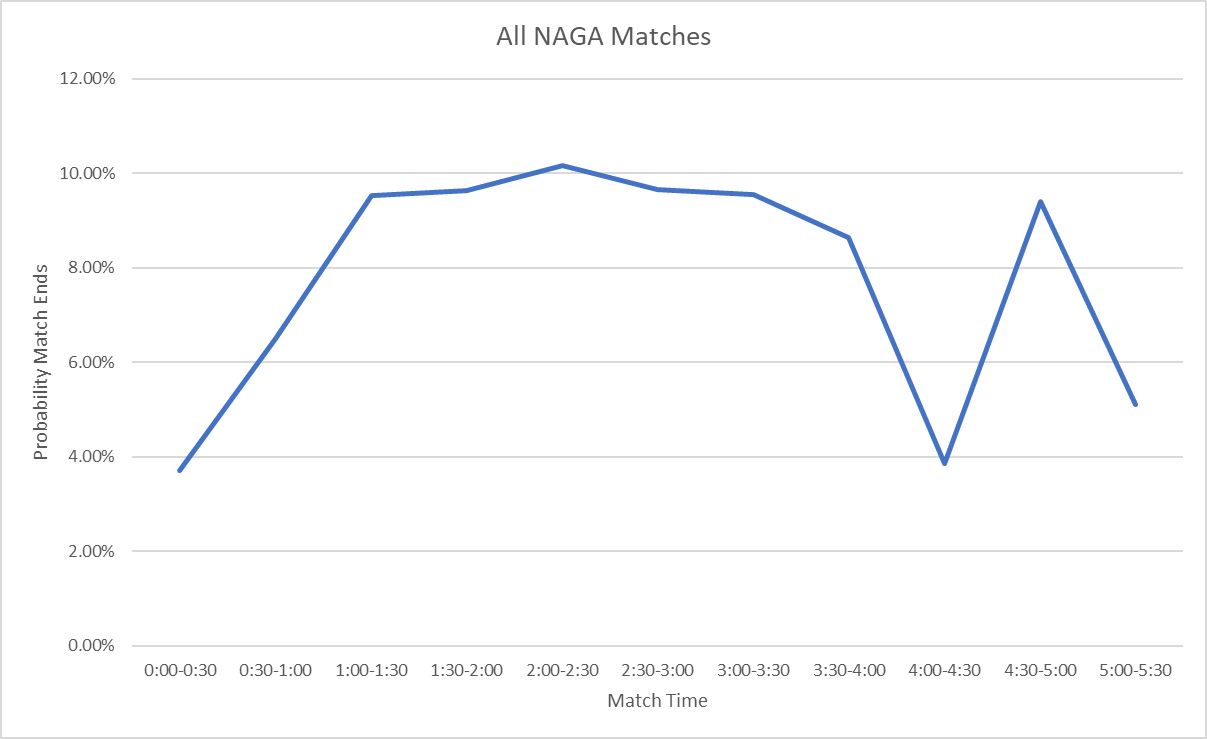
So what are we looking at here? This chart shows the probability of the match ending before the end of that bucket, if that match is still active when it reaches that given bucket. For example, at the 2:00-2:30 bucket the hazard probability is 10.16%, meaning there is a 10.16% probability that the match will end by the 2:30 mark.
First, you’ll notice a big dip at the 4:00 mark. That’s to be expected, as that is where novice, beginner, white belt, and Masters matches end. All other ability levels go to either 5 or 6 minutes.
The second thing you might notice is that the match lengths only go up to 5:00-5:30. That’s because any matches that are still going beyond that point have a 100% chance of ending between 5:30-6:00, as there will either be a submission, or regulation time will have been reached.
Once again, we see that the highest probability of the match ending occurs right in the middle. This is looking at all NAGA matches (20,873) and isn’t splitting out ability/belt, so take that for what its worth. As we saw in the previous example, there’s more volatility in gi matches, so I would expect that this chart will look different when we start digging down into the different layers. A project for another day.
How this might apply to competition prep
For one, as I just mentioned, it would be more valuable to see the information at a more granular level to see how it might apply to my athletes. I would likely run this for everyone competing, and maybe even get as specific as their exact bracket (gender, rule set, ability, age, weight class) to see if there are any trends to spot (provided it’s a large-enough sample size). This could give me an idea of match pacing, cardio training needs, mental training needs, etc. It can also inform how we train so that they can get a winning position early on and hold on to it.
Do these numbers really matter?
Yes and no.
The numbers are a slice of time, they tell a story of what happened.
They might be predictive. If a large-enough trend happens over a long-enough period of time, it could be reasonable to assume that things will continue on that trend for the foreseeable future.
What they do not do is account for the individual. They do not give us much nuance in terms of how these things happened, and they don’t provide causality. They don’t account for the outliers, how people think, feel, and react in the real world.
Coaches should incorporate objective data in their decision-making, not be driven solely by it. I can’t ignore that there is a huge spike in submission concentration in the first minute of no-gi matches, and that should inform how I help my athletes prepare; but to ignore the fact that a BJJ match is a chaotic environment and to remove the human element that may not be explained by the numbers would be a disservice to my athletes. As coaches, we need to amalgamate the science with our experience, apply the objective to the subjective elements of the real world.